


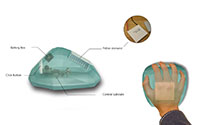
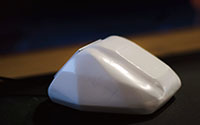
Thermo user interface
To use a computer, one only employs two senses out of five: hearing and sight. In the present study, touch is added to the senses in human-computer interaction. Mouse temperature changes to present the digital content and informs a computer user about the changes in the digital environment. Temperature is controlled by the Peltier element. I employed this idea to present landscape changes on a map. Whenever a mouse cursor was placed on the mountainous region, the mouse got warmer. Vice versa, the depth of ocean and inland waters was signalled with mouse getting colder. Thus, by using more senses, user reached deeper understanding of territory. There are also other applications of this. For instance, a warmer mouse tells about the importance of a CTA button on a web page or a colder mouse informs a gamer about a critical loss of health points in a digital battle.
3 examples using temperature
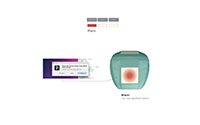
- In Games
- Tell own residual life
By temperature is better than by visual information to know about lives.I guess human inadvertently perceive through temperature that something organism is alive. For example when we shaking hands or hag each other, we can feel the partner’s body temperature.The heat is one of the primary factor to trust each other or it is a origin of peace of mind. I think it applies to digital information. Something exist can be better told by temperature than by sight.
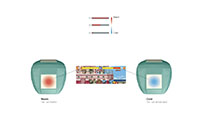
- Computer interface
Tell what the significant button is
Tell information in 2 ways , visually and by temperature. In order to reduce errors when you utilize computer software, it`s worth to use a temperature. For example, when you need to chose one button, and there is no mending,the computer changes the temperature of the significant button to tell user which button is more important. Then user can make out the materiality of buttons through temperature when user puts the mouse cursor on the proper button.
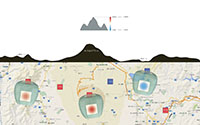
- On Maps
Tell the elevation on 2D maps
Reduce the visual informations on map and
Think about new interactive map.
On maps it teems with visual informations.(name of cities, addresses, buildings etc.) I realize the limitations of adding visual informations on maps. Therefore maps need another medium to be improved, which does not rely on just visual things. On this map, when you trace with the mouse on, the elevation report will be returned by temperature.